Building Interactive Data Dashboard
- Status: Closed
- Prize: $1000
- Entries Received: 6
- Winner: daeilk

Contest Brief
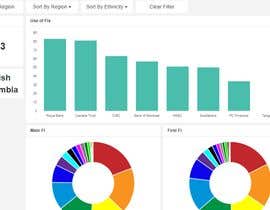
I need a custom interactive dashboard that shows raw data that we have collected. An example screenshot is attached which looks good so you can see an idea of what we are looking for. I would like it to look something like that.
I also attached an Excel file of a spec that shows the questions that we need to display and the questions (on another sheet) that we need to use as filters. The filters need to be interactive so that a user can click on something (e.g., Ontario) and then it will filter down into the results for Ontario. The raw data are also attached.
There will be extra consideration for people who make it look good, for example: using graphics (e.g., a map for region) for filters to make it visually appealing AND functional. A good User Experience is most important.
When the dashboard is done, we need to be able to port it over to our server to host it.
I need this ASAP so I am paying a premium. I would like it ready in 2 days if possible but it definitely needs to be done by Sunday at the latest (in 4 days). Then we can port it over to our system Monday morning. I set the contest for 5 days to give time to sort everything out, including porting to our server.
Recommended Skills
Employer Feedback
“Great work. Very helpful with some follow ups and changes. Good freelancer.”
![]() joeldig, Canada.
joeldig, Canada.
Public Clarification Board
How to get started with contests
-

Post Your Contest Quick and easy
-

Get Tons of Entries From around the world
-

Award the best entry Download the files - Easy!